


Source: Square
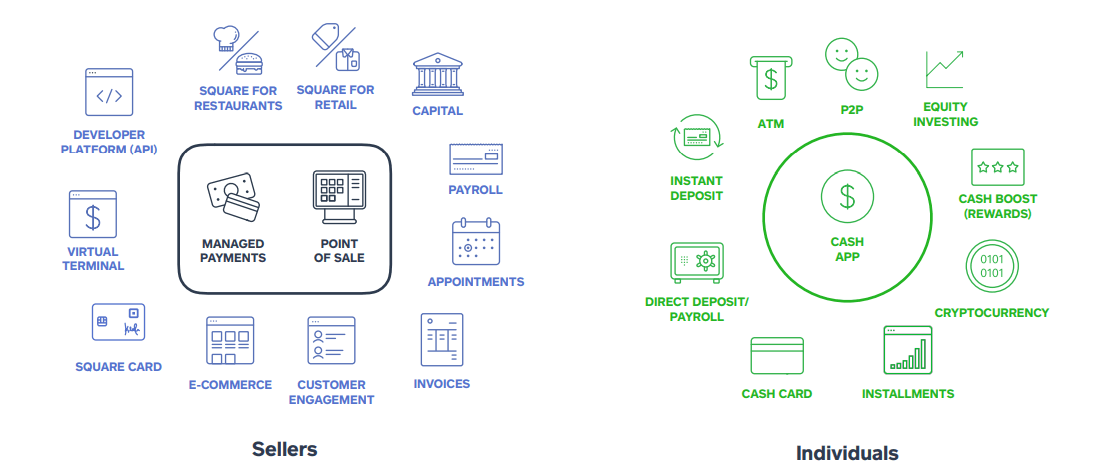
Square, Inc. (SQ) is one of the fastest growing Fintech companies. Initially specializing as a point-of-sale (‘POS’) solutions provider and payment processor for small businesses, the company has expanded its services by establishing a comprehensive commerce ecosystem integrating many value-added services to help sellers start, run and grow their businesses. Besides merchants, it is successfully establishing its consumer market reach with the Cash App, targeting a younger user base by offering more convenient and engaging services such as P2P payments and zero-commission trading.
Source: Square
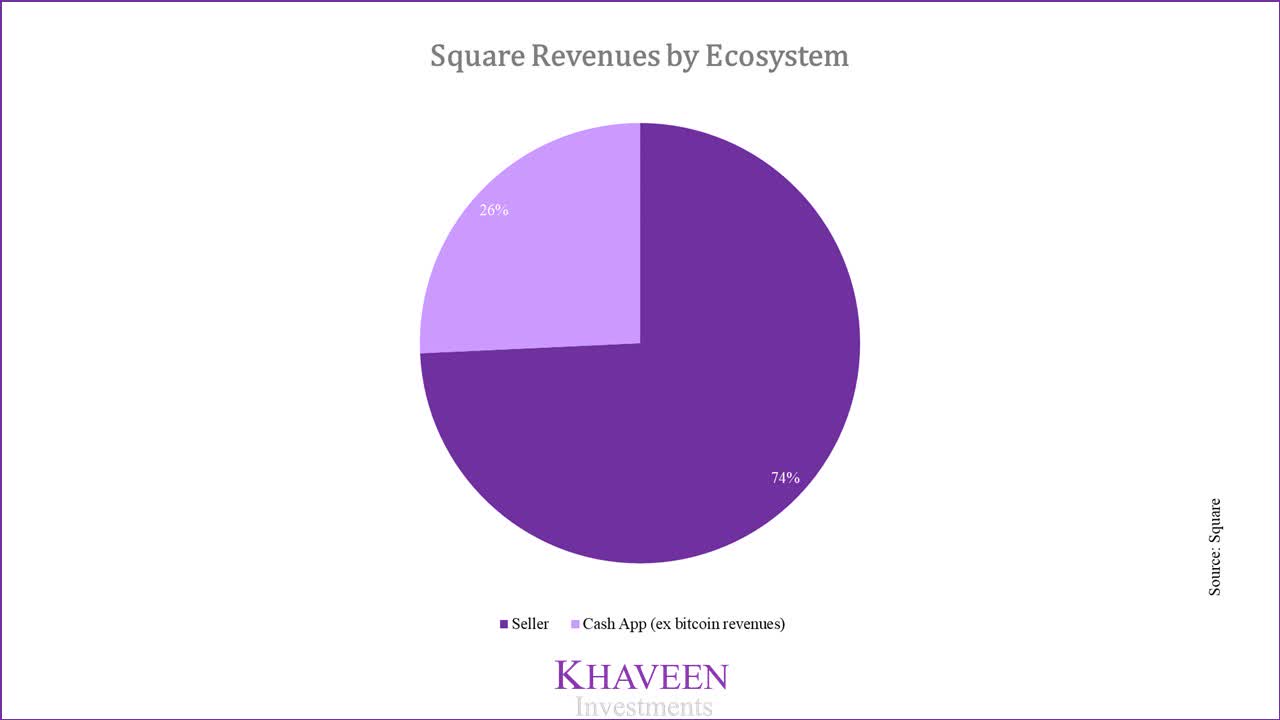
In 2020, the company has started to segment its results based on the Seller and Cash App ecosystem. Excluding bitcoin revenues, the seller ecosystem accounts for the majority or almost three quarters of total revenues. The Cash App accounts for the remaining revenues, but is growing at a faster pace.
Source: Square
Online Channels and SaaS to boost Seller Ecosystem
Table of Contents
The company’s seller ecosystem is built upon its core payment processing abilities. With a focus on empowering small businesses, the company has grown its merchant base to over 2 mln, processing $106 bln in transactions or gross payment volume (‘GPV’) in 2019. It takes a cut on each transaction as transaction-based revenues, its primary source of adjusted revenues and most lucrative with a gross margin of around 40%.
Its merchant mix consists of sellers from the food and beverage (26%), retail (17%), beauty and personal care (11%) industry. GPV took a hit as merchants were forced to shut down due to the pandemic. However, the impact has been felt less than feared, with GPV declining only about 15% year on year. The decline was offset by a 50% year on year growth in online GPV as Square assisted merchants to transition to its online channels. As restrictions continue easing and consumer spending starts picking up, we see GPV recovering further.
Yearly | 2012 | 2013 | 2014 | 2015 | 2016 | 2017 | 2018 | 2019 | 2020F |
Gross Payment Volume($ bln) | 6.52 | 14.82 | 23.78 | 35.64 | 49.68 | 65.34 | 84.65 | 106.24 | 97.08 |
Growth rate | 127% | 60% | 50% | 39% | 32% | 30% | 26% | -9% |
Source: Square, Khaveen Investments
However, it remains a question if volumes can continue to grow beyond the recovery phase. As seen in the table above, GPV had been on the wane even before the pandemic. Management has factored this to intense competition for larger size merchants by competitors such as Paypal (PYPL). Yet, the company still manages to grow and attract larger merchants, categorized as those with payment volumes of over $125,000, which now makes up 52% of its merchant mix compared with 39% five years ago.
We believe the company can continue to grow GPV due to two main drivers:
- increasing traction on its online channels
- robust value-added services to retain larger sellers which contributes to its top line growth
First, with its online strategy, it is seeing remarkable online channel GPV growth of more than 50% YoY. The company is pushing towards the rapidly growing e-commerce market with a range of SaaS solutions besides payment checkout such as the Square Online Store, Invoices, Virtual Terminal and eCommerce API. This has enabled Square to assist its existing physical merchants to adapt online, while acquiring new merchants as well. Digital volumes from online channels now account for 25% of GPV and we see this increasing further with the rise in e-commerce. JP Morgan (JPM) estimates US e-commerce accounts for 8.9% of retail sales, which trails behind China at over 23% of sales, signaling an opportunity for the US e-commerce market to grow further, which would benefit Square’s seller ecosystem.
Source: Square
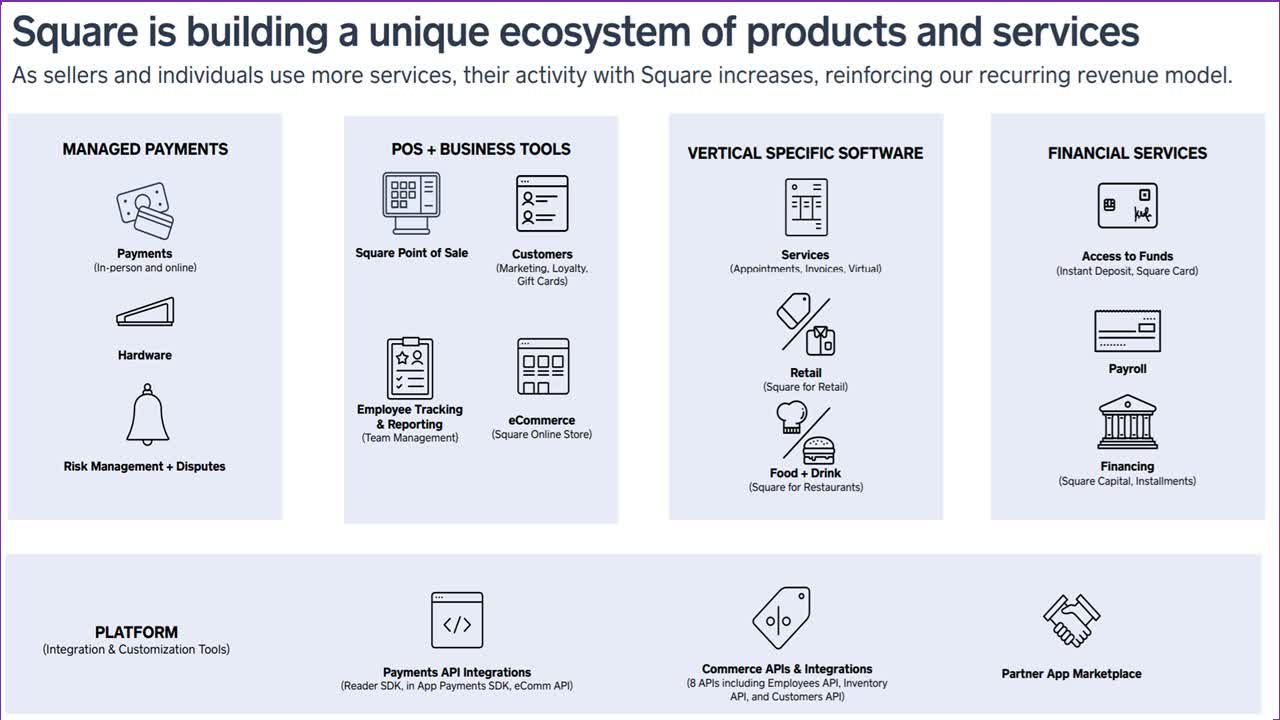
Besides e-commerce, the company also has a robust product and services ecosystem for physical sellers. Its strategy is to offer different tiers of services depending on the size of the merchants. The basic tier caters to small retailers and restaurants with basic PoS features. Whereas for larger sellers, the company offers a bundle of additional services including management and analytic software for customer retention such as Payroll, Marketing and Loyalty products. It also provides financing to sellers through Square Capital, which utilizes algorithms to evaluate sellers based on real-time payments data.
Overall, Square continues to build and deepen its merchant relationships by upselling, allowing the company to keep sellers dependent on its ecosystem and to grow its top line through subscription and service-based revenues.
Cash App ecosystem benefitting from P2P and cryptocurrency volume surge
Launched in 2013, the Cash App is a mobile payment service allowing users to transfer money to one another. It represents Square’s success in reaching the consumer market with more than 30 mln monthly active users registering a 60% year on year increase, outpacing fiercest rival Venmo (owned by Paypal).
Cash App vs Venmo | Cash App | Venmo |
Active users | 30 mln | 40 mln |
Growth Rate (YoY) | 60% | 50% |
Estimated revenues | $1 bln | $450 mln |
Take Rate | 1.5% | 0.44% |
Source: Square, Paypal, Ark Invest, Bankrate
While Paypal has a larger user base with a wider reach across different geographical markets, Cash App’s success is attributed to a more robust product portfolio, which complements its core P2P payments services, including:
- the Cash Card
- direct deposits
- Boost
- stock and cryptocurrency trading
These solutions not only enable the company to keep up user engagement, but it also provides multiple opportunities for monetization which explains the higher run rate.
It earns transaction fees from P2P transfers along with subscription and services revenue from the Cash Card, a debit card linked to a user’s Cash App balance instead of a bank account as well as through direct deposits. The Cash Card is gaining traction and has grown to 7 mln users, which has doubled from a year ago and have seen impressive quarterly growth of 50% even as most US card spend was down, contributing to subscription and service growth, which has risen 116% year on year in the first half of this year. We believe usage will continue to grow as it is further integrating the card for new users to automatically receive a direct deposits account to be used to receive deposits or pay bills.
Another unique aspect of the Cash App is stock and cryptocurrency trading. By offering zero-commission trading on a digital wallet, users have the choice to invest surplus funds without leaving the platform. This feature has resonated well with its younger market reach with trading activity surging on the platform as seen with the rise in bitcoin revenues by 520%.
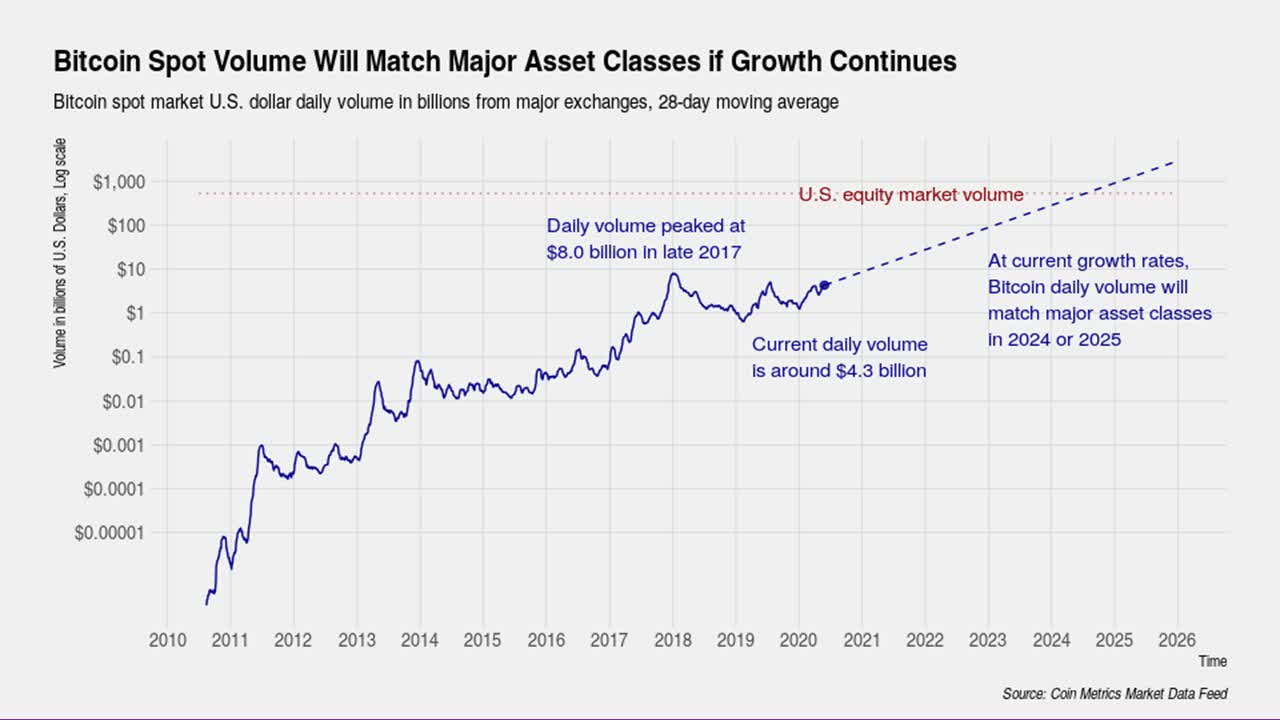
Source: Coin Metrics
No doubt, the bitcoin and to a larger extent, the cryptocurrency market is extremely volatile with wild price swings. But volatility has little effect on Square, instead, its growth is driven by surging daily trading activity. According to Coin Metrics, the current daily trading volume of Bitcoin is $4.3 bln. This is eclipsed by other major asset classes such as US equity ($446 bln), bonds ($893 bln) and global FX ($1,987 bln). However, Bitcoin volume is seeing explosive growth and is on track to surpass all major asset classes by 2025, representing an annual growth rate of 247%.
To sum it up, two factors that support our expectations for continued growth in Cash App are P2P growth and cryptocurrency activity. While it earns only a thin margin of 1 to 2% on the spread, we believe the trading feature has a greater benefit of attracting users to its Cash App and retaining them with added solutions, which have multiple monetization opportunities.
Long term opportunity to expand beyond the US
One downside of Square is that it still generates most of its sales within the US, accounting for 95% of total revenues. While the rest of its sales are derived from its international operations in Canada, United Kingdom, Australia and Japan. The company is presented with opportunities to further expand in these markets which has a combined population of 250mln.

Source: Square
Although facing formidable competition from fintech rivals such as Paypal, Square has managed to consistently build on its customer and seller relationship by innovating and adding value-added products and services to retain and attract users.
The company has partnered up with regional banks in these markets to assist it to expand at a faster pace. For example, in Australia, it has a partnership with regional banks including Unity Bank, Southern Cross Credit Union and WAW Credit Union to promote its card readers and digital payment products in their stores and websites to 100,000 potential customers.
Also, Square’s international fees are slightly higher compared with fees charged in its domestic market. Together with a partnership with Mitsui Sumitomo Bank, the third largest bank in Japan, it charges 3.25% for processing fee which is higher than the 2.5% for US merchants but still lower than competitor Paypal with a 5% fee.
Overall, we believe the company has an incredible long-term opportunity to expand in international markets. Although representing only 5% of sales, we believe the company’s initial efforts will result in stronger growth in the future. Of course, there is still plenty of room for expansion in the US, but the company has plenty of prospects in the $200 bln global Fintech market.
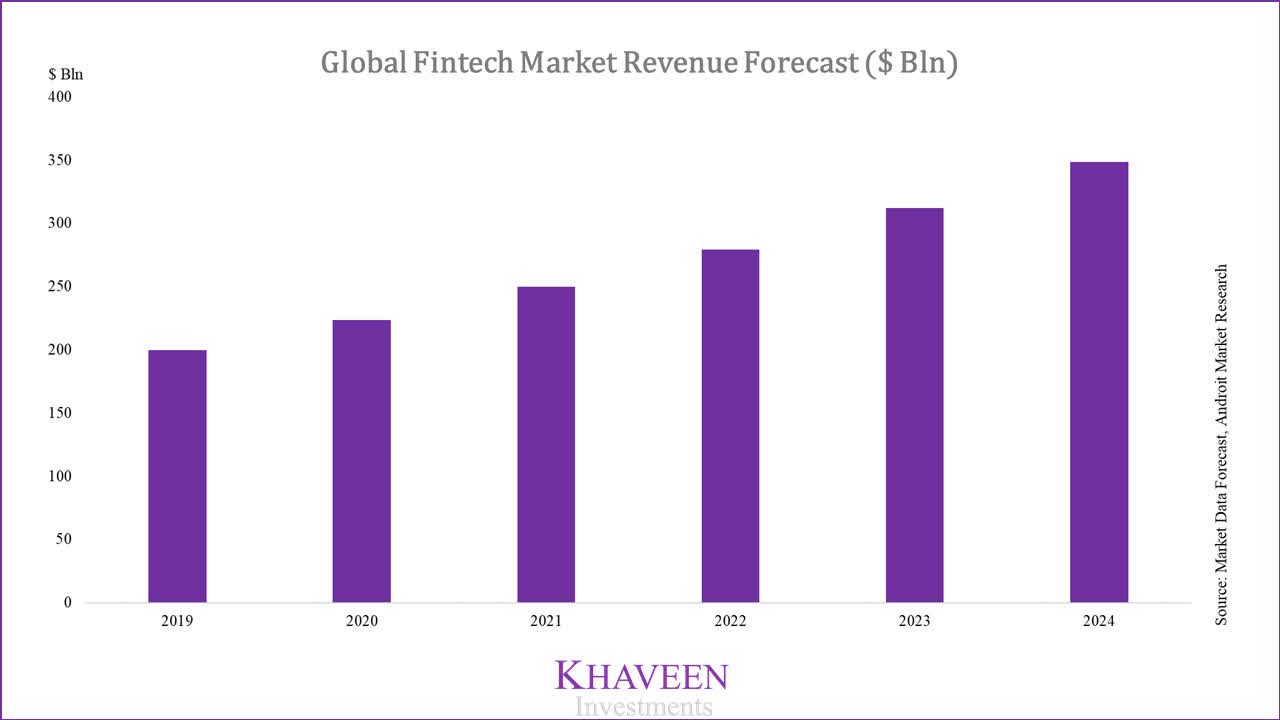
Source: Market Data Forecast, Androit Market Research
Valuation
To value the company, we start by projecting the revenues of each segment based on their services. Starting with the Seller ecosystem, we forecast transaction-based revenues to increase 19.7% on rising US e-commerce market volumes and non-cash retail PoS growth. We believe the company’s bundle of PoS software and hardware enables it to continuously grow robustly at 15.1% and 20%, which is in line with industry averages.
As for the Cash App ecosystem, we see the company benefitting from increasing consumer adoption of P2P mobile payments apps in the US, which currently stands at an adoption rate of 29%. Our transaction and subscription growth forecast of 66% is based on the assumption that the adoption rate reaches 80%. The main driver for Cash App is bitcoin, which we project will grow 247% annually as daily trading volumes continue to surge despite price volatility.
Square Segmental Growth Rate | Seller Ecosystem | Cash App Ecosystem |
Transaction based | 19.7% | 66% |
Subscription and service-based | 15.1% | 66% |
Hardware | 20% | – |
Bitcoin | – | 247% |
Source: JP Morgan, eMarketer, Grand View Research, Modor Intelligence, Coin Metrics, Khaveen Investments
Seller Revenues | 2020F | 2021F | 2022F | 2023F |
Transaction based | 2,718,394 | 3,253,918 | 3,894,939 | 4,662,242 |
Subscription and service-based | 355,258 | 408,902 | 470,646 | 541,714 |
Hardware | 79,994 | 95,993 | 115,191 | 138,230 |
Total seller | 3,153,646 | 3,758,812 | 4,480,777 | 5,342,186 |
Seller Growth Rate | 19.2% | 19.2% | 19.2% | |
Cash App Revenues | 2020F  | 2021F | 2022F | 2023F |
Transaction-based | 162,952 | 270,500 | 49,031 | 745,391 |
Subscription and service-based | 929,762 | 1,543,405 | 2,562,052 | 4,253,007 |
Bitcoin | 2,363,108 | 8,199,985 | 28,453,947 | 98,735,196 |
Total Cash App | 3,455,822 | 10,013,890 | 31,465,030 | 103,733,594 |
Cash App Growth Rate | 189.8% | 214.2% | 229.7% |
Source: Khaveen Investments
While its revenue growth may appear to be very impressive, especially with seller revenues, this is due largely to how Square recognizes revenue with bitcoin – it records the entire transaction as revenue which may seem misleading. To acknowledge this, we separated bitcoin revenue to arrive at its adjusted revenue figures and gross profit after deducting estimated cost of sales. As seen below, the company’s growth rate is still highly attractive even after netting off bitcoin.
Square Financials | 2020F | 2021F | 2022F | 2023F |
Total Revenue | 6,609,468 | 13,772,702 | 35,945,807 | 109,075,780 |
Adjusted Revenues (Net of Bitcoin) | 4,246,360 | 5,572,718 | 7,491,860 | 10,340,583 |
Gross Profit | 2,279,600 | 2,305,595 | 3,448,201 | 5,948,590 |
Growth Rate | 20.2% | 1.1% | 49.6% | 72.5% |
Source: Khaveen Investments
Now that we have an idea of what the company’s growth could look like, we apply a discounted cash flow model to value the company.
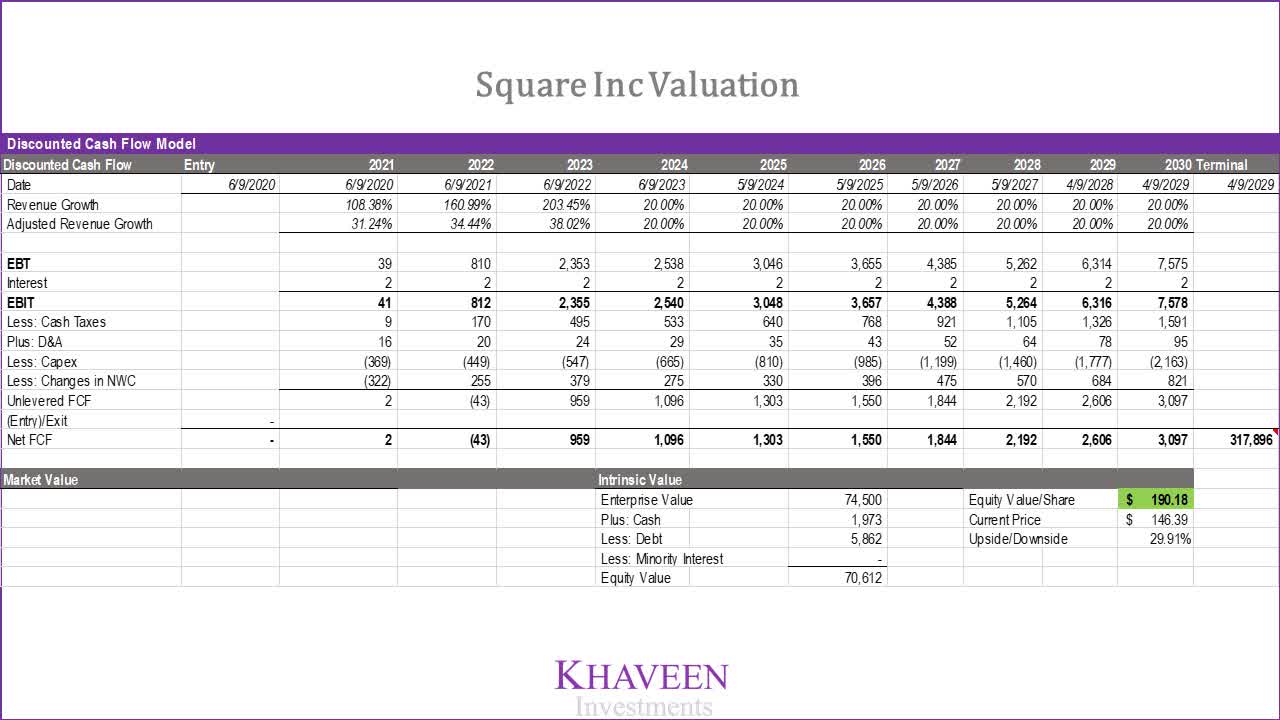
Source: Khaveen Investments
Based on DCF analysis, with an EV/EBITDA of 41.43x (digital payments industry average) and a discount rate of 18.5% (Company WACC), while conservatively estimating revenue growth to taper off from 2024 at an average rate of 20%, the fintech market growth rate, our model shows an upside of 29.91%.
Verdict
Square is built on the principle of an ideal Fintech business model, empowering the underserved by integrating a holistic product and service portfolio designed by leveraging technology to offer a seamless and convenient experience for customers. It is continuously innovating to add value to its seller and Cash App ecosystems which allow it to develop a deeper relationship with its users and build customer retention while at the same, providing multiple avenues of monetization opportunities.
While the stock is already up 129% YTD, and there is an increasing divide on whether the company is overvalued, we continue to believe in the long-term potential of the company, benefiting from tailwinds on seller ecosystem with rising e-commerce and contactless payment solutions, not to mention rising P2P payment adoption and surging cryptocurrency trading activity. Additionally, the company has yet to realize its full growth potential in the international market. All in all, we rate the company as a Buy with a target price of $190.18.
Note: For more research and analysis of high-quality companies within the global fintech industry, please click the “Follow” icon at the top of this page.
Disclosure: I/we have no positions in any stocks mentioned, but may initiate a long position in SQ over the next 72 hours. I wrote this article myself, and it expresses my own opinions. I am not receiving compensation for it (other than from Seeking Alpha). I have no business relationship with any company whose stock is mentioned in this article.
Additional disclosure: No information in this publication is intended as investment, tax, accounting, or legal advice, or as an offer/solicitation to sell or buy. Material provided in this publication is for educational purposes only, and was prepared from sources and data believed to be reliable, but we do not guarantee its accuracy or completeness