


BTC/USD Price Technical Outlook
Table of Contents
- Will bears take advantage of bull’s hesitation?
- Levels and trading zones to consider on BTC/USD chart
BTC/USD – Disrupted Rally
Last week, Bitcoin rebounded from its highest level in nearly four weeks at $7.455 then retreated after. On Friday, the price closed the weekly candlestick with a bearish Doji pattern, highlighting a possible upcoming reversal.
The Relative Strength Index (RSI) remained flat above 50 reflecting the lack of impulse to start uptrend move.
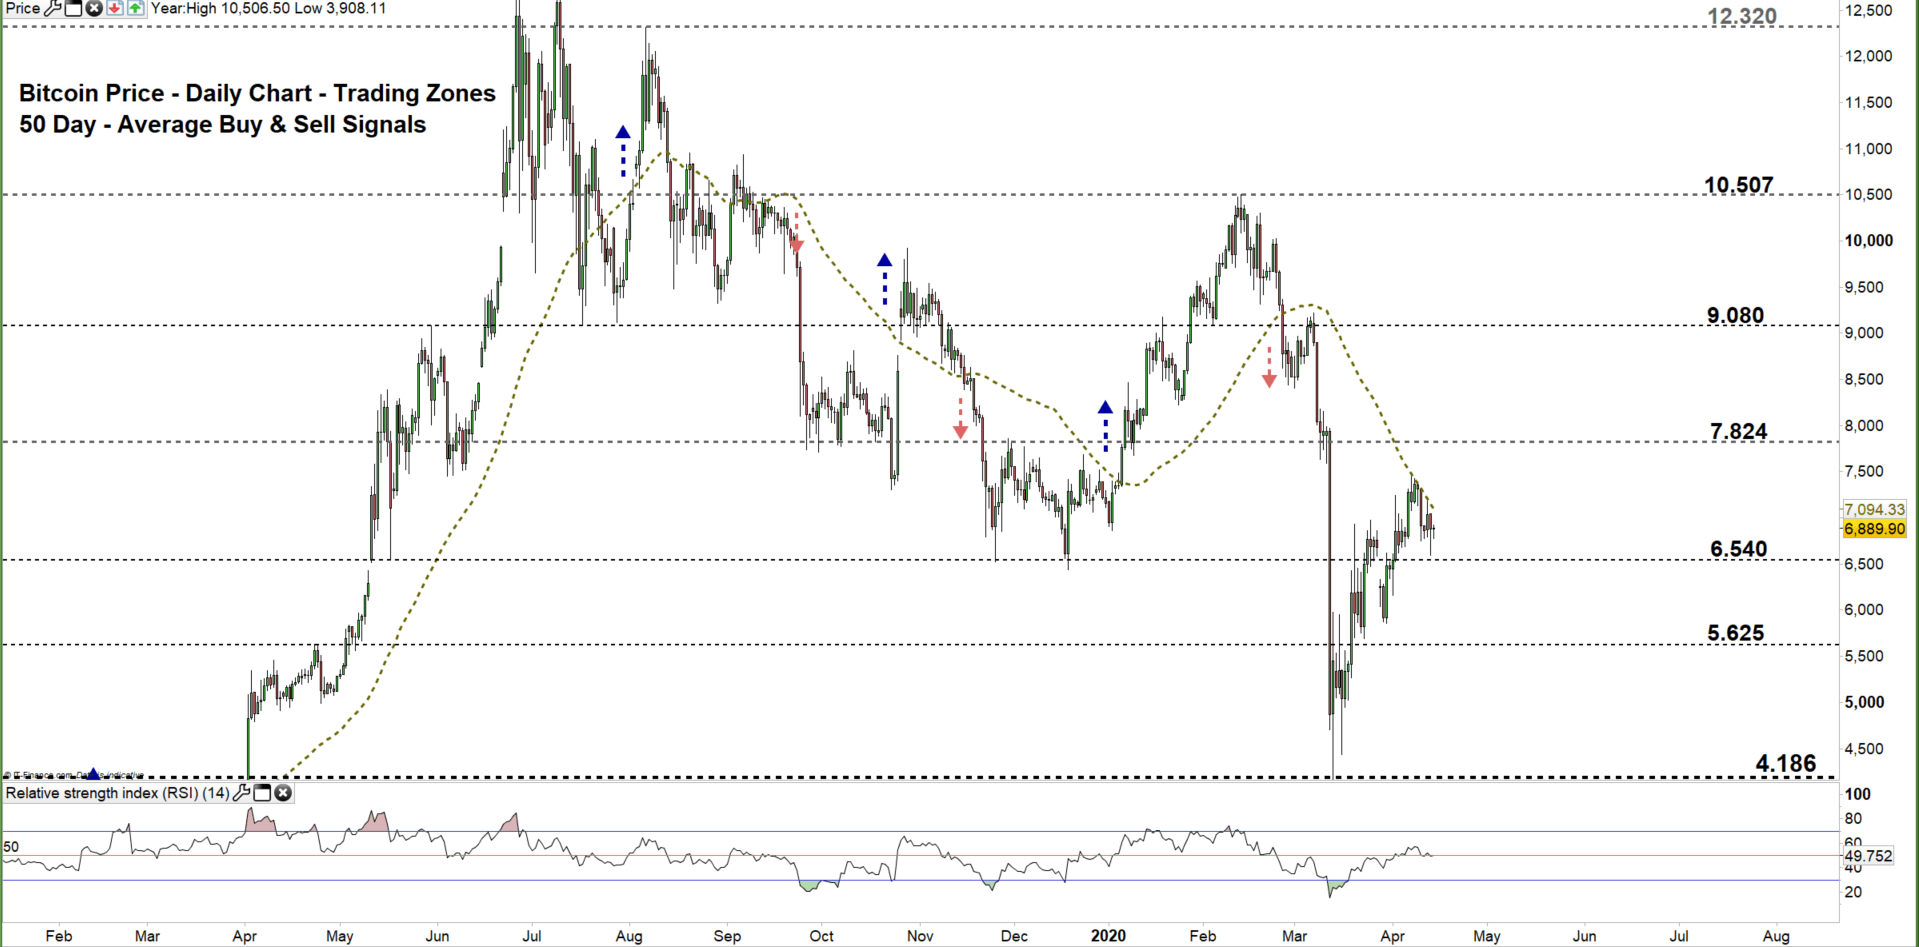
Bitcoin PRICE DAILY CHART (FEB 15 – April 14, 2020) Zoomed Out

Recommended by Mahmoud Alkudsi
Traits of Successful Traders
Bitcoin PRICE DAILY CHART (JAN 15 – April 14, 2020) Zoomed In

Looking at the daily chart, we noticed that on April 2 Bitcoin climbed to current trading zone $6.540- $7.824. Yet, the price failed in multiple occasions to overtake the 50-day average reflecting bulls hesitation at this stage.
Thus, a close below the low end of the zone opens the door for bearish comeback and possibly lead the price towards $5.625. Further close below that level could send the BTC/USD even lower towards $4.186. That said, the weekly support levels underscored on the chart (zoomed in) should be kept in focus.
On the flip-side, any close above the high end of the zone could encourage bulls to push towards $7.824. Further close above this level could mean more bullishness towards $10.507. Nevertheless, the weekly resistance levels marked on the chart should be monitored.

Recommended by Mahmoud Alkudsi
Building Confidence in Trading
Bitcoin PRICE FOUR Hour CHART (Mar 15 – April 14, 2020)

Looking at the four-hour chart, we noticed that on Friday the price broke below the uptrend line originated from the March 30 low at $5.855. Later on, Bitcoin developed head and shoulders pattern. Therefore, any violation to the neckline located at $6.615 could lead the price towards $5.864.
A break below $6.330 would be considered another bearish signal. This increases the likelihood of falling towards $5.864. Yet, the weekly support level underlined on the chart should be considered. In turn, any break in the other direction i.e. above 7.301 could cause a rally towards $7.708. Although, the daily resistance level printed on the chart should be watched closely.
See the chart to know more about the critical levels in a further bearish/ bullish move.


Recommended by Mahmoud Alkudsi
Improve your trading with IG Client Sentiment Data
Written By: Mahmoud Alkudsi
Please feel free to contact me on Twitter: @Malkudsi