


BTC/USD Price Technical Outlook
Table of Contents
BTC/USD – Weaker Bulls
On Monday, Bitcoin rallied to a near two-week high at $9,788. However, the price reversed lower and closed the weekly candlestick in the red with a 1.2% loss.
The Relative Strength Index (RSI) fell from 56 to 44 highlighting a possible start of a bearish momentum.
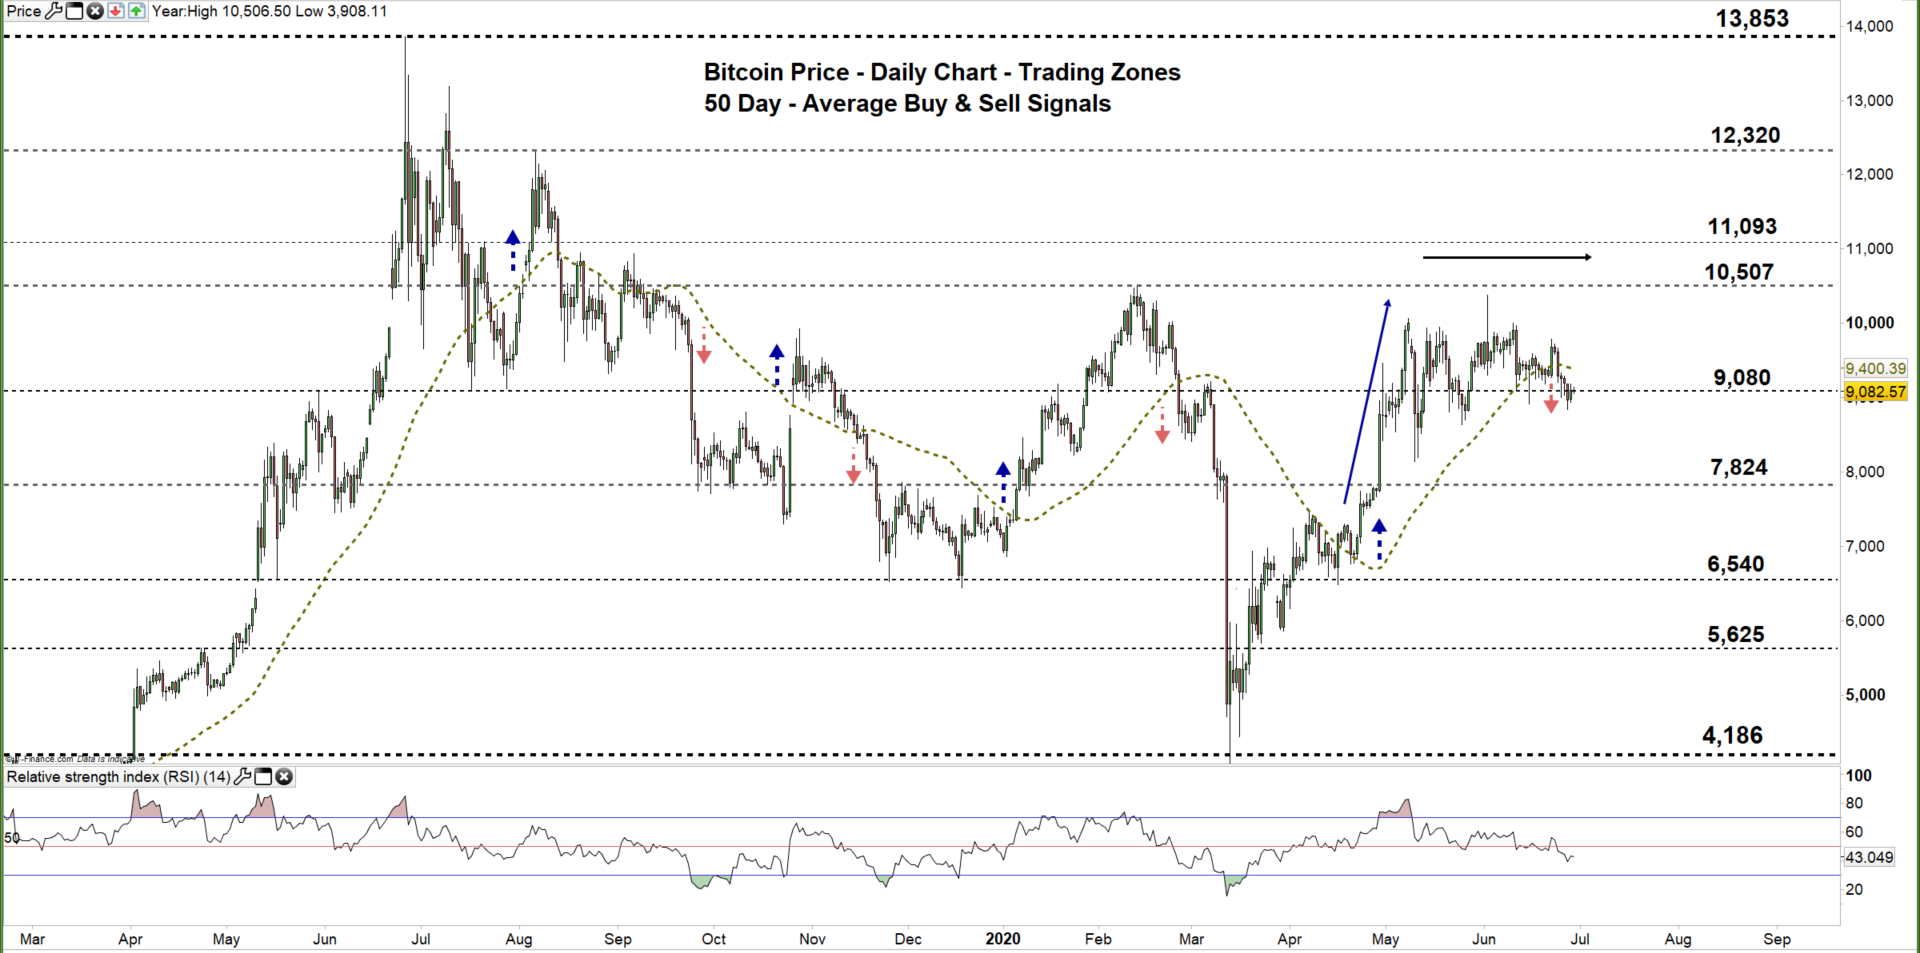
Bitcoin PRICE DAILY CHART (MaR 1, 2019 – June 29, 2020) Zoomed Out

Recommended by Mahmoud Alkudsi
Traits of Successful Traders
Bitcoin PRICE DAILY CHART (April 20 – June 29, 2020) Zoomed In
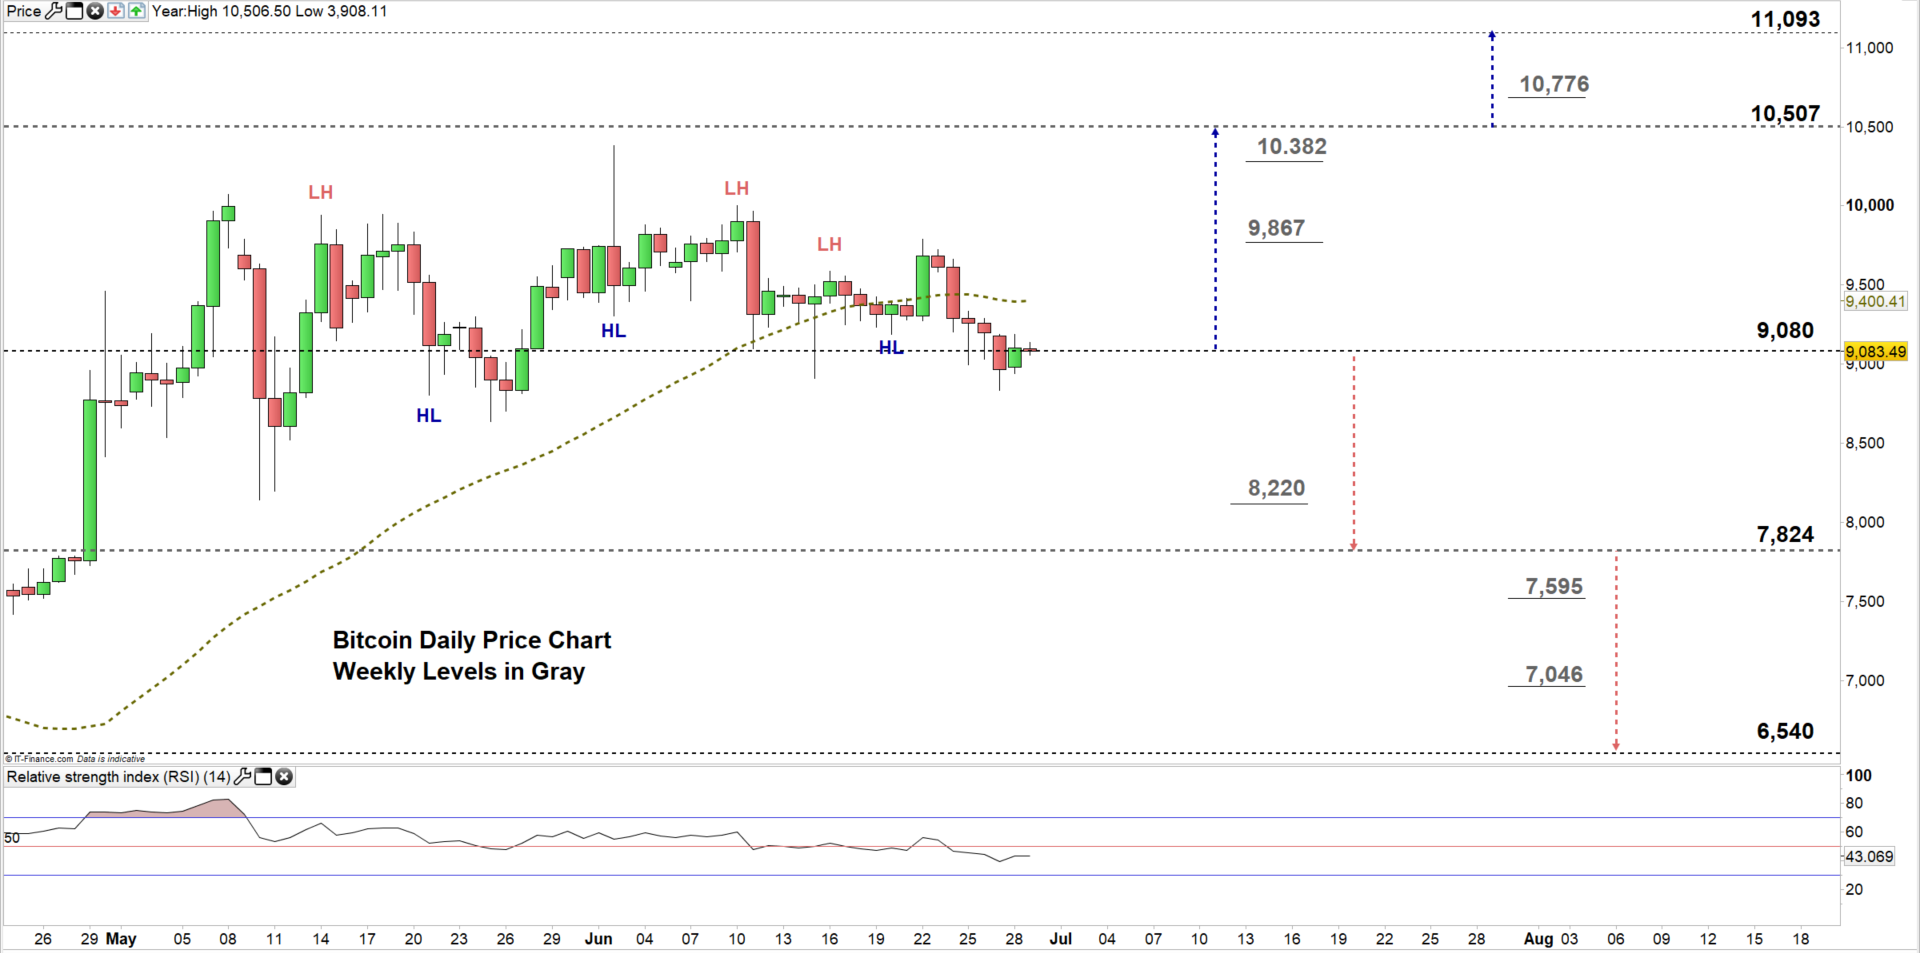
Last month, Bitcoin paused its upward trend then traded in a sideways move creating a set of lower highs with higher lows. Yesterday, the price climbed back to the current trading zone $9,080 – $10,507 hinting a continuation of the trendless move.
Another close above the low end of the zone signals that Bitcoin may rally towards the high end of it. A further close above that level could extend the rally towards $11,093.
On the flip-side, a close below the low end of the zone could send BTC/USD towards $7,824. Any further close below that level may send the price even lower towards $6,540.

Recommended by Mahmoud Alkudsi
Building Confidence in Trading
Bitcoin PRICE FOUR Hour CHART (June 9 – June 29, 2020)
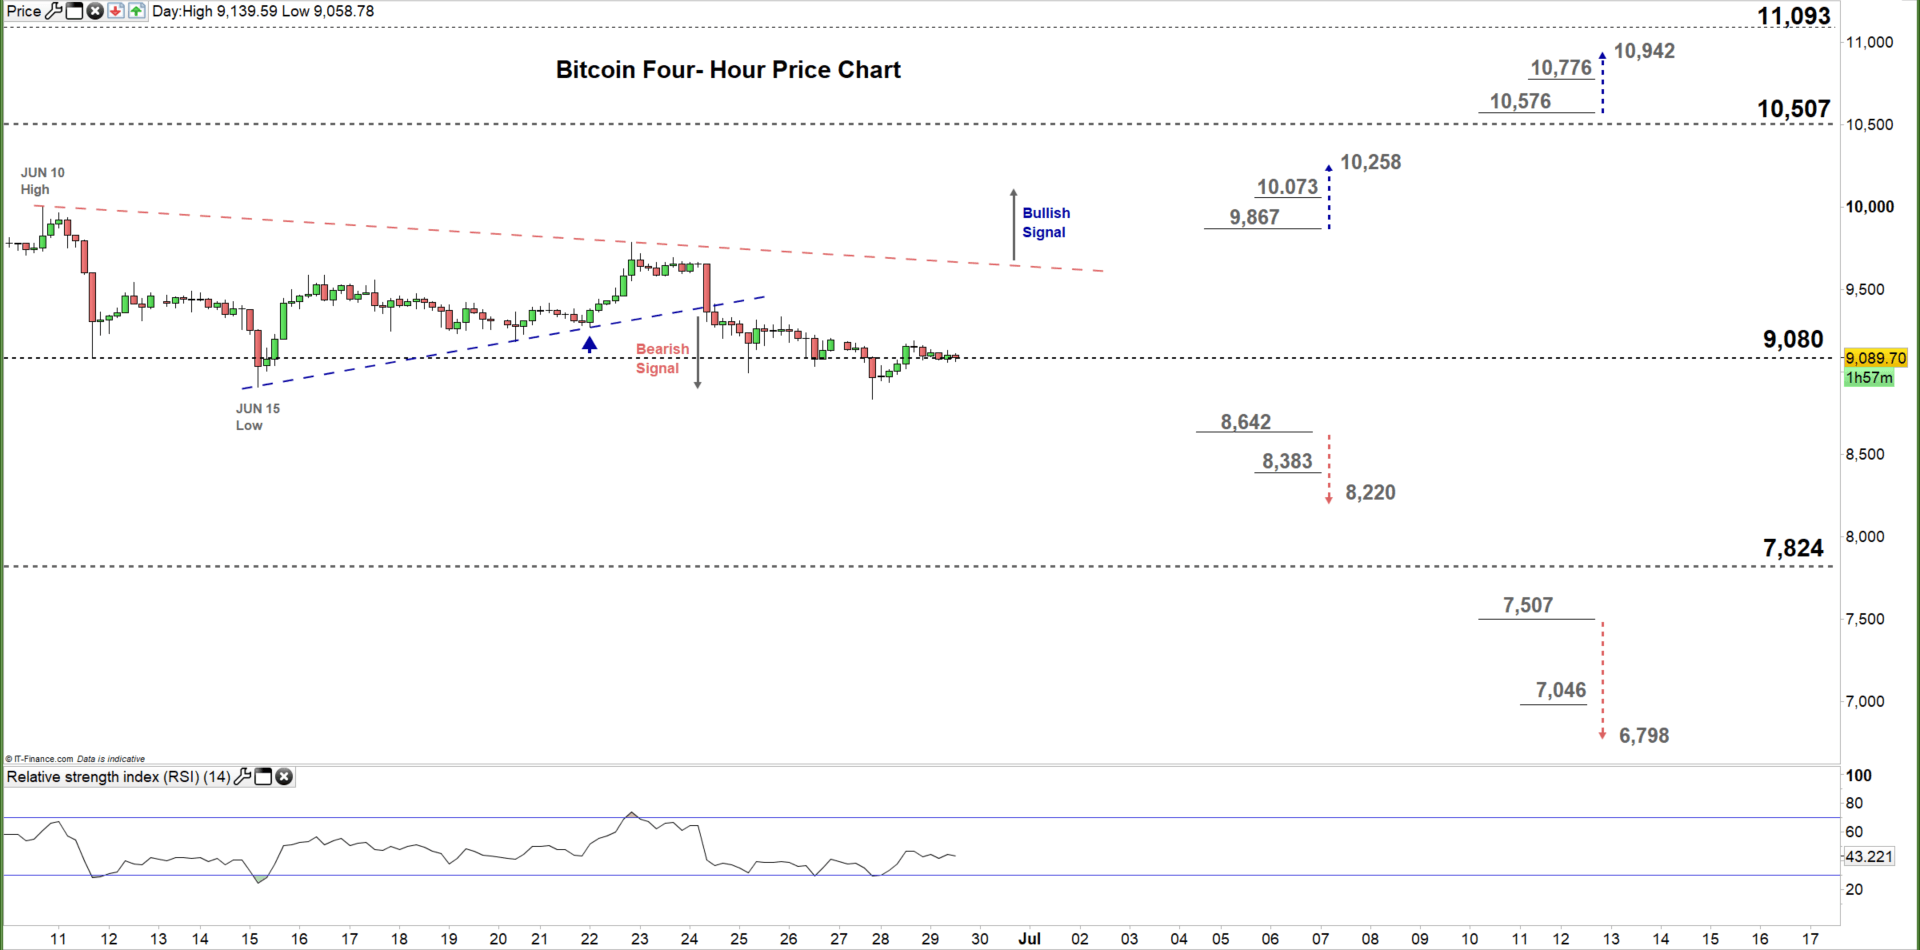
On Wednesday, Bitcoin broke and remained below the uptrend line originated from the June 15 low at $8,911, and generated a bearish signal. With that said, any violation of the downtrend line originated from the June 10 high at $10,002 would generate a bullish signal.
Thus, a break below $8,642 could send BTC/USD towards $8,220 while any break above $9,867 may trigger a rally towards $10,258. Nonetheless, the weekly support and resistance marked on the four-hour chart should be monitored.


Recommended by Mahmoud Alkudsi
Improve your trading with IG Client Sentiment Data
Written By: Mahmoud Alkudsi, Market Analyst
Please feel free to contact me on Twitter: @Malkudsi