


Bitcoin Forecast: BTC/USD Price Faces a Key Resistance Level
Table of Contents
BTC/USD Price Technical Outlook
BTC/USD – Indecisive Traders
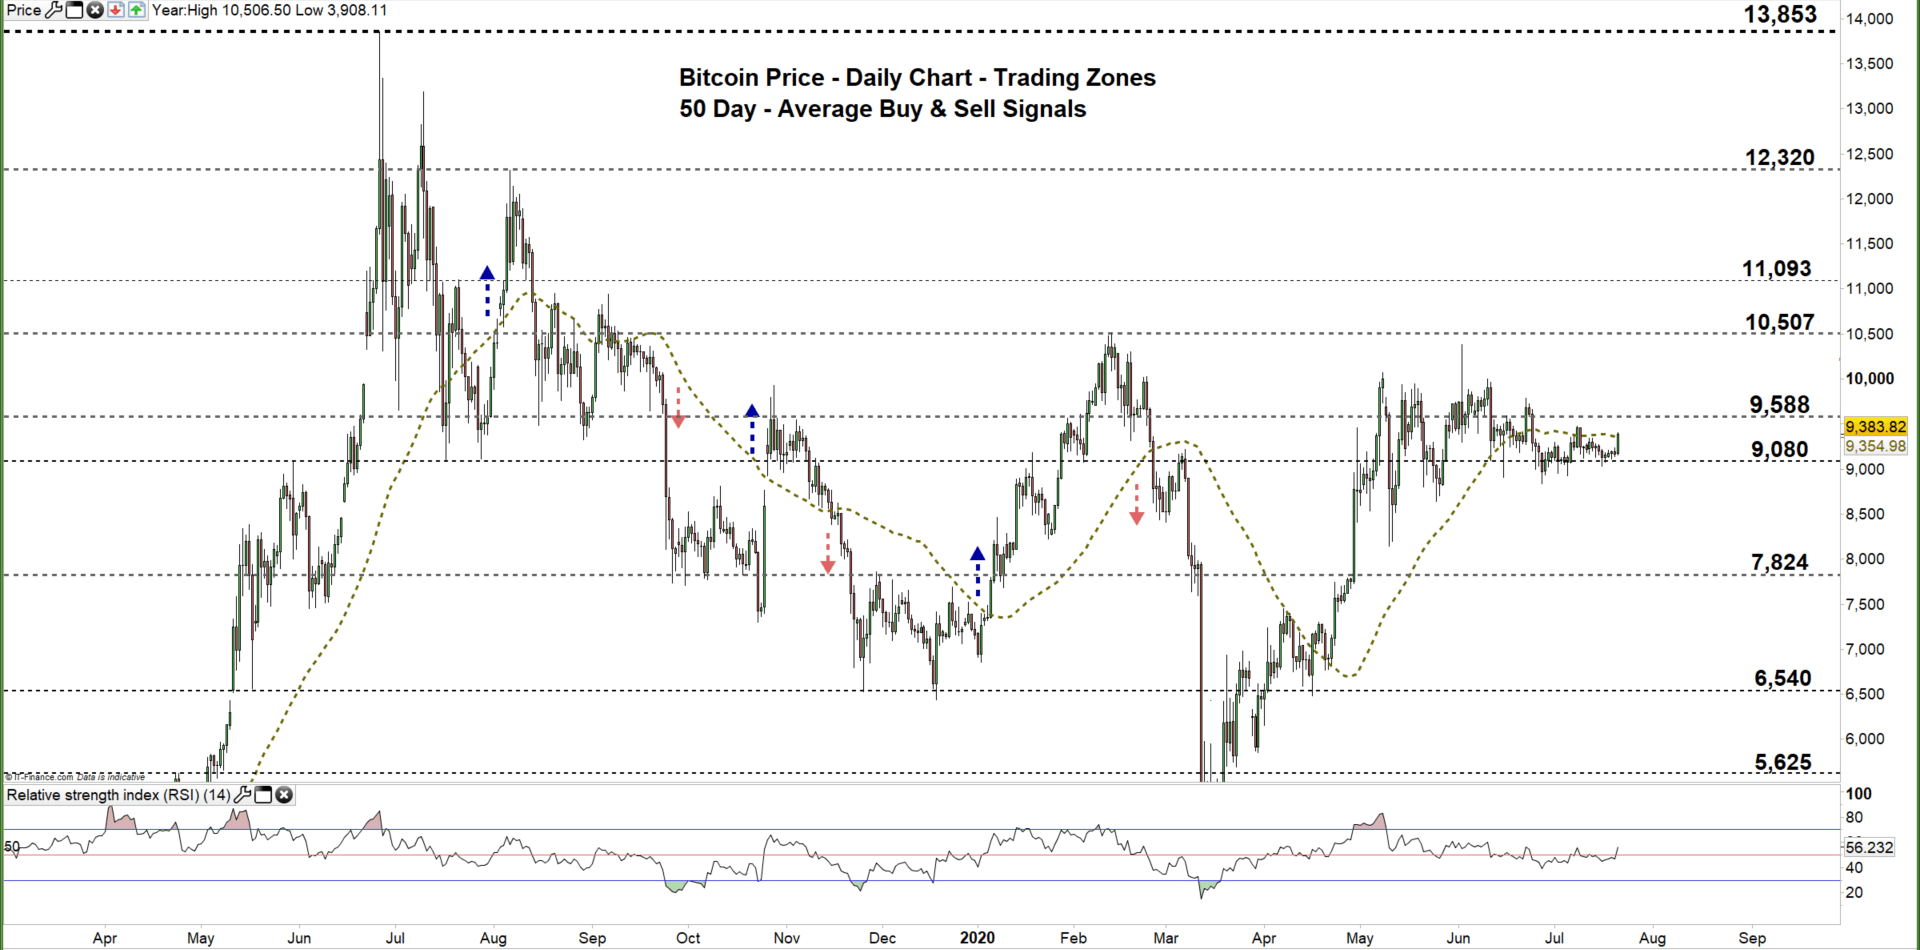
Last week, Bitcoin hit a near two-week low of $9,033 without committing to a new bear trend. Ultimately, the pair recovered and closed a weekly candlestick with a Doji pattern highlighting the market’s indecision.
Alongside that, the Relative Strength Index (RSI) remained near to 50 reflecting weak bears and weaker bulls.
Bitcoin PRICE DAILY CHART (MaR 1, 2019 – July 21, 2020) Zoomed Out

Recommended by Mahmoud Alkudsi
Traits of Successful Traders
Bitcoin PRICE DAILY CHART (June 20 – July 21, 2020) Zoomed In
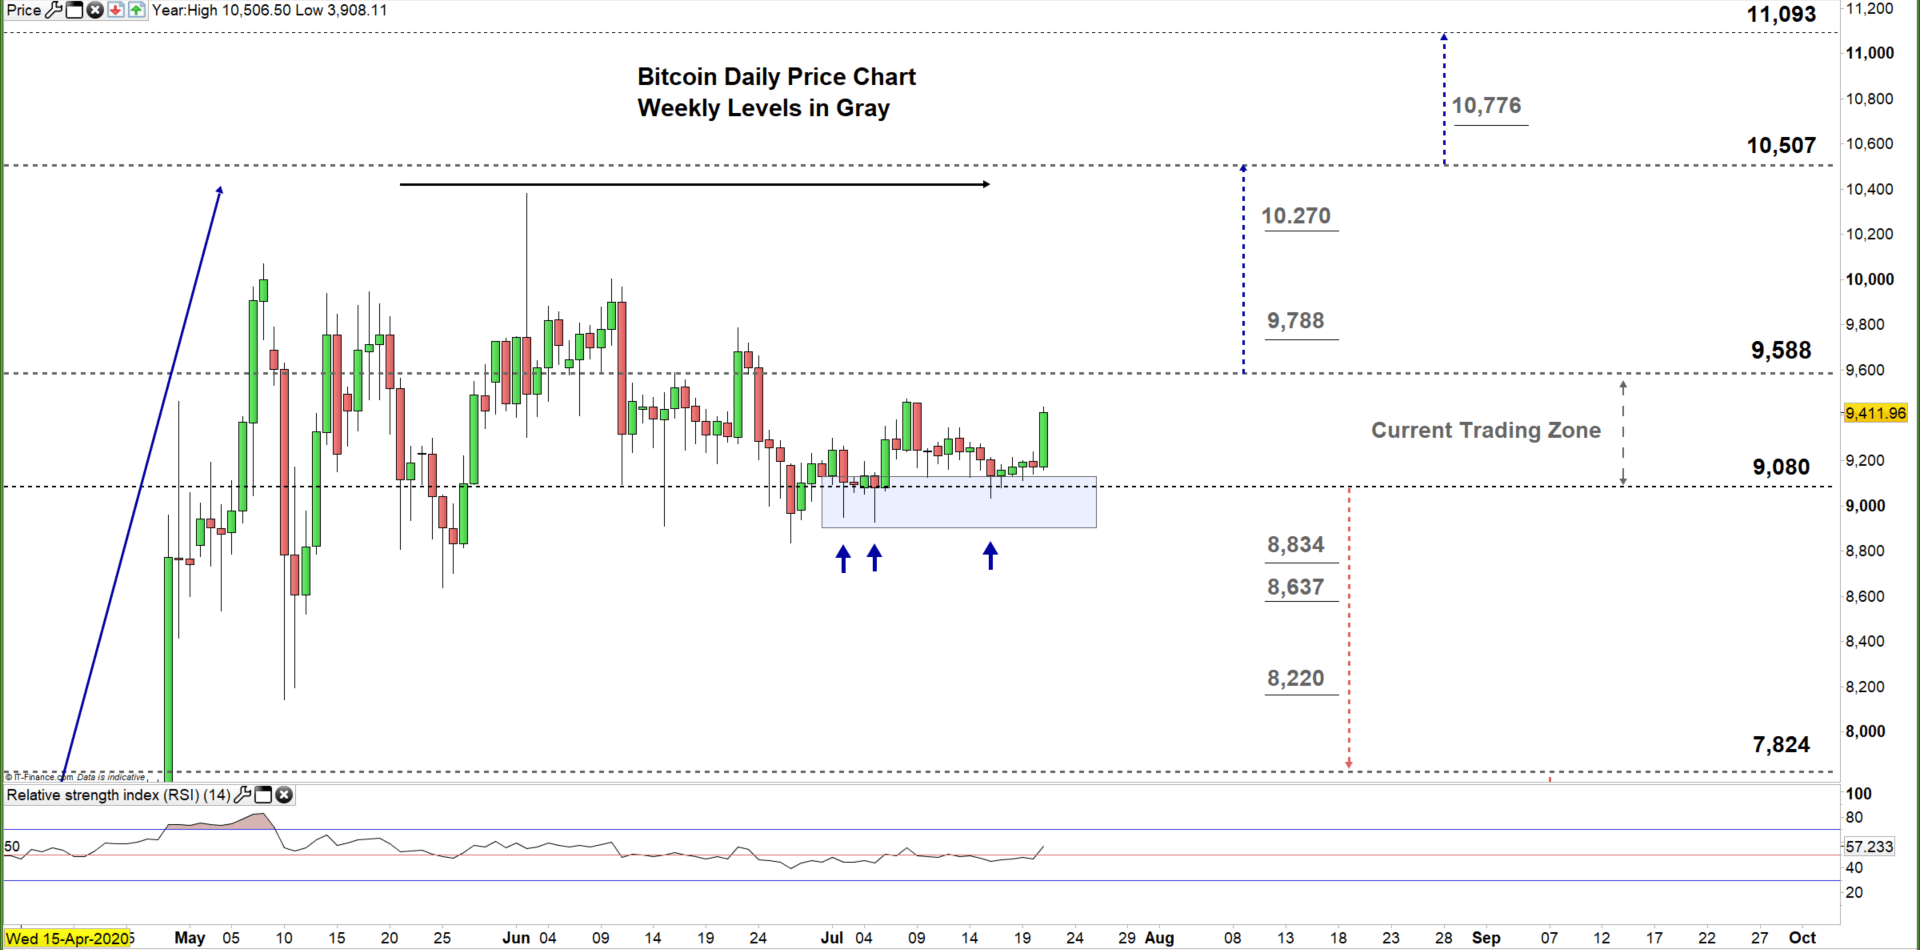
On June 27, Bitcoin pulled up from a multi-week slide and climbed to the current trading zone $9,080 – $9,588. Since then, the price has failed on multiple occasions to break through the lower trading zone, repeatedly rebuffing efforts to put bears in charge.
A close above the high end of the current trading zone may start a rally towards the monthly resistance at $10,507, and a further close above that could encourage bulls to extend the rally towards $11,093.
On the other hand, any failure in closing above the high end could reverse the price’s direction towards the low end of the zone, and any further close below that level could embolden bears to send BTC/USD even lower towards the monthly support at $7,824.

Recommended by Mahmoud Alkudsi
Building Confidence in Trading
Bitcoin PRICE FOUR Hour CHART (June 27 – July 21, 2020)
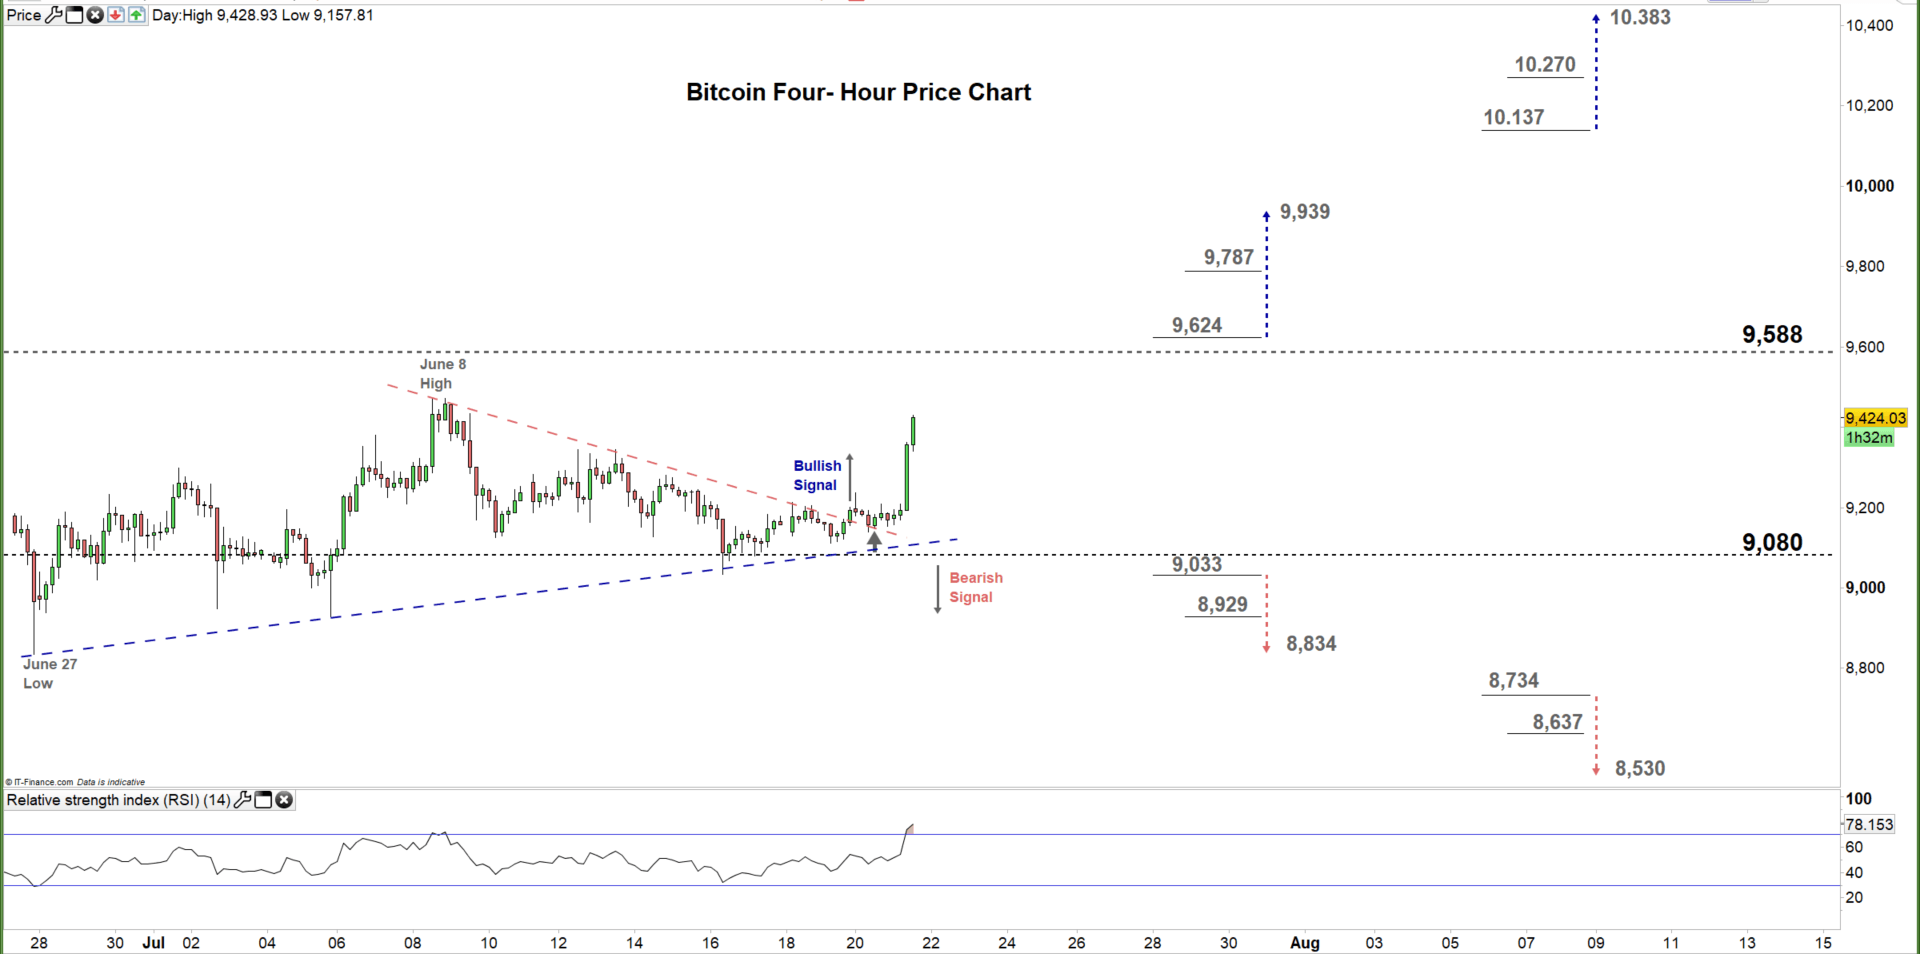
On Sunday, Bitcoin traded above the downside sloping trendline resistance originating from the June 8 high at $9,474, indicating a shift in favor of the bull’s control, which has thus far held. However, any break below the upward trendline support originating with the June 27 low at $8,434 may keep the bullish potential alive.
To conclude, a break above $9,624 may trigger a rally towards $9,939, while a break below $9,033 could send BTC/USD towards $8,834. As such, the weekly support and resistance levels underscored on the four-hour chart should be monitored.


Recommended by Mahmoud Alkudsi
Improve your trading with IG Client Sentiment Data
Written By: Mahmoud Alkudsi, Market Analyst
Please feel free to contact me on Twitter: @Malkudsi